Keywords
health service executive, eligibility rates, general medical services scheme, local health office
health service executive, eligibility rates, general medical services scheme, local health office
Ireland currently has a mixed public-private system of healthcare. Entitlement to publicly-funded healthcare services is largely via the General Medical Services (GMS or “medical card”) scheme1. This scheme provides access to a range of healthcare services at no or low cost to approximately one third of the population2. This includes unlimited visits to general practitioners (GP) and other community services, emergency department visits, and hospital inpatient care, free to patients at the point of access. It also includes dispensing of a wide range of prescribed medications which are reimbursed to pharmacies by the Irish health service, where a small prescription charge applies to patients per item dispensed (currently €1.50 or €1 for those aged 70 years and over), with a monthly household cap (€15 or €10 for over 70s).
Entitlement to services under the GMS scheme is mainly based on income, with lower income thresholds for older adults resulting in higher eligibility in this group. The income thresholds have varied over time, based on government budgetary decisions. In a small proportion of cases, eligibility is granted on a discretionary basis if there is evidence of high medical expenses. In 2021, approximately 11% of all medical cards were discretionary3.
Individuals eligible for the GMS scheme are often a focus of research, as a population that account for a large proportion of healthcare services use4. In addition, the management of the GMS scheme results in the generation of administrative data, which represent an important resource for health research5, and has been linked with other research data to facilitate pharmacoepidemiology studies6–8. An important consideration in any research focussing on GMS scheme eligible individuals as the study population is their representativeness and the potential for selection bias. Therefore, the aim of this study is to describe the eligibility rates and representativeness of the GMS scheme population over time, with respect to age group, sex, and geographical area in Ireland.
This is a repeated cross-sectional study.
Population data for 2016–2021 were obtained from the Central Statistics Office (CSO) via Ireland’s Open Data Portal9. The census is a legally mandatory count of the population and is completed by each household every five years. For 2016, census data from April of the same year was used, as this was when the census was last recorded. For 2017–2021, estimated population figures for April each year based on Census 2016 projections were obtained. Data included single year of age and sex for the estimated years, while Census 2016 data also included information at county level. The CSO does not provide population estimates by county, age, and sex for non-Census years. Age groups were created to match those reported for the GMS eligibility figures (0–4, 5–11, 12–15, 16–24, 25–34, 35–44, 45–54, 55–64, 65–69, 70–74, and 75+ years).
GMS eligibility figures for 2017–2021 were obtained from the Health Service Executive (HSE) Primary Care Reimbursement Service (PCRS) via the PCRS’s Reporting and Open Data platform, while 2016 figures were requested directly from the PCRS. Aggregate figures for number of GMS-eligible individuals by age group and sex were extracted for April 2016–2021 to correspond with Census population figures. For April 2016, information at HSE Local Health Office (LHO) level (i.e. geographical areas for the administration of healthcare entitlements) was also obtained. As LHOs do not correspond directly to counties, broader areas combining counties and/or LHOs were created to provide equivalence for analysis purposes (see Table 1).
The characteristics of the GMS population per year were summarised. Crude eligibility rates were calculated for 2016–2021 by age group and sex, and demographic group (children, 0–15 years; adults, 16–64 years; and older adults, 65+ years), along with the relative rate of eligibility (how much more or less likely a member of a particular age or sex group was to be eligible compared to the general population). The crude eligibility rate per year was calculated, and the yearly rates were also directly standardised to the 2016 population based on age group and sex.
For the area-level analysis, crude eligibility rates were calculated using Census 2016 data and April 2016 eligibility data and directly standardised to national population based on age group and sex. Standardised eligibility rates were plotted on a map by area. Analyses were conducted using Stata version 1710, and figures were generated in RStudio using the tmap and ggplot2 packages11,12
Characteristics of the GMS population over time are included in Table 2. The GMS population decreased from 1,735,534 in 2016 to 1,554,759 in 2020, and increased to 1,581,294 in 2021. The 75+ years age group was the largest group throughout the study period, ranging from 13.0% in 2016 to 15.8% in 2021. Conversely, 0–4 years age group was consistently the smallest, ranging from 5.8% in 2016 to 4.4% in 2021. Females made up the majority of the GMS population throughout the study period, increasing from 53.1% in 2016 to 54.1% in 2021.
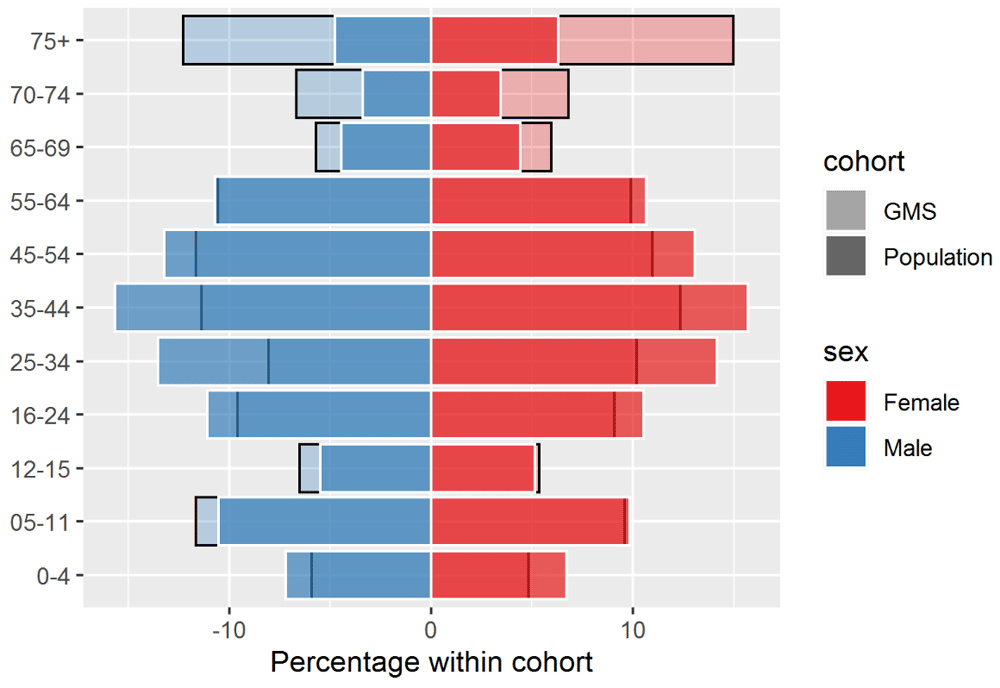
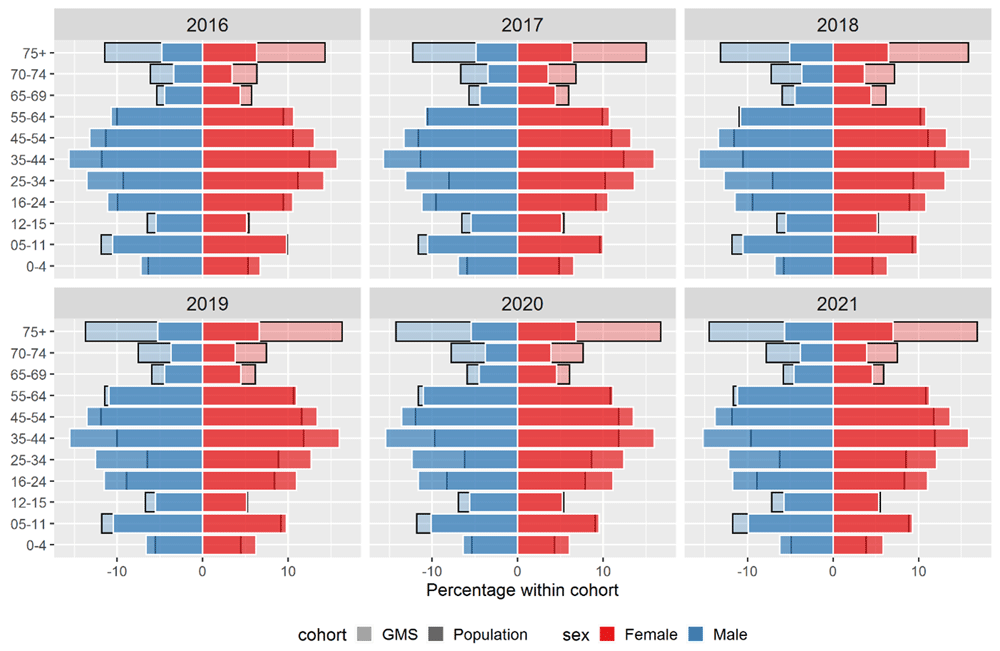
Table 3 shows the eligibility rates and relative rates by age group and sex. In the 75+ years age group, 85.2% of the total population were eligible for the GMS scheme in 2016, decreasing to 78.2% in 2021. The age group with the lowest rate of eligible individuals was the 25-34 age group, with 27.0% eligible in 2016 and 19.5% in 2021. The eligibility rate was higher among females compared to males throughout the study period, with 38.2% eligible in 2016 and 33.9% in 2021, compared to 34.6% and 29.2% for males. Figure 1 shows a population pyramid, depicting the percentage of males and females across each age group within GMS eligible individuals, compared to the full population for 2016. The 75+ age group was the most overrepresented in the GMS population in 2016. Among males, individuals aged 75 and over made up approximately 5% of the full population and 12% of the GMS population, while for females, individuals aged 75 and over made up approximately 6% of the full population and 15% of the GMS population. Those aged 5–15 years, and to a greater extent those 65+ years, were overrepresented across all years, and females were overrepresented relative to males (see Figure 2 for population pyramids across years).


Crude and adjusted eligibility rates over time are included in Table 4. The crude rate decreased from 36.4% in 2016 to 31.2% in 2020, with a slight increase to 31.6% in 2021. After directly standardising the rate to the 2016 population based on age group and sex, a similar pattern was observed with 30.8% (95% confidence interval 30.88% to 30.96%) adjusted eligibility rate in 2021.
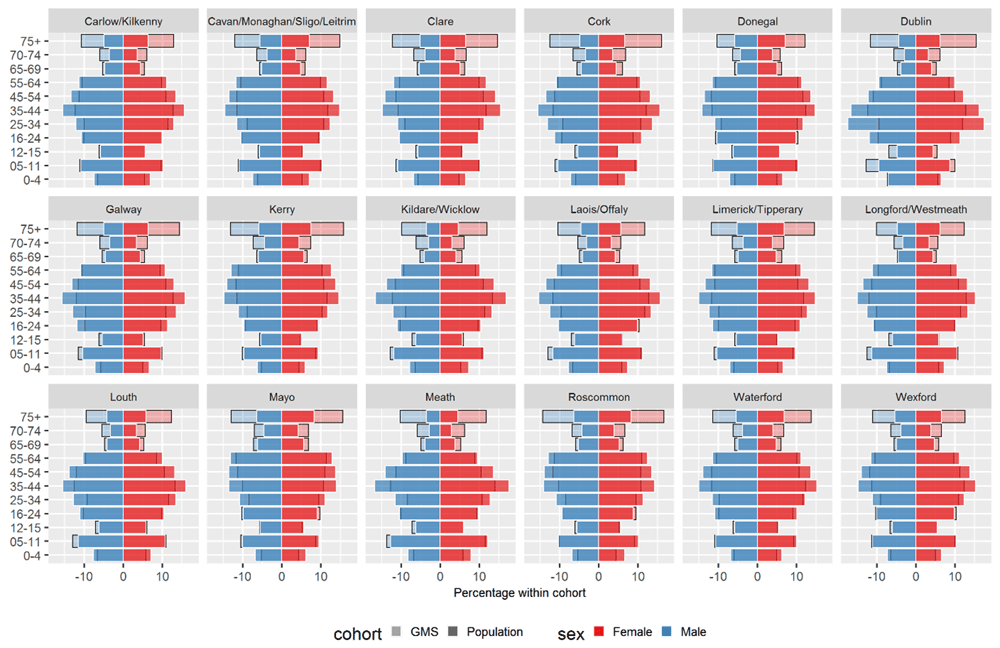
Table 5 shows the crude eligibility rate by area for 2016, and rates directly standardised to the national population based on age group and sex. Population pyramids by area are shown in Figure 3. The highest rate was seen in Donegal, with a crude rate of 52.8% and an adjusted rate of 52.0% (95% CI 51.7% to 52.2%). Dublin had the lowest rate, with a crude rate of 29.3% and an adjusted rate of 30.1% (95% CI 30.0% to 30.2%). Figure 4 shows a map of the adjusted eligibility rates across areas.

The decreasing trend in eligibility rate from 2017 is consistent with previous analysis, which identified a rise from approximately 30% to over 40% from 2008 to 2013 (during the economic crisis affecting Ireland), followed by a decrease in 2014 and 201513. The slight increase in eligibility rate from 2020 to 2021 could be partially attributable to the adverse financial impact of the coronavirus disease 2019 (COVID-19) pandemic14.
As expected given that eligibility is often based on income, the areas we identified as having the highest rates are somewhat similar to those with higher levels of deprivation15. However, because of the grouping of areas in our analysis to allow for comparable population and eligibility figures, many of the highest deprivation areas were grouped with others, precluding direct comparison.
Considering representativeness of health data drawn from routine sources (as non-random samples) is important for assessing the external validity of research. A recently published analysis of the OpenSAFELY data, derived from GP records in England and used extensively since the onset of the COVID-19 pandemic to generate evidence, suggests some geographic variation but otherwise good population representativeness16. Even for prospectively collected research data, such as the UK BioBank, consideration of representativeness and the potential for healthy user bias is important17. As well as undermining generalisability, selection bias may also impact internal validity, where sampling into the study is affected by both the exposure and outcome of interest, and thus the exposure-outcome association may be biased18. As the GMS scheme is means tested, older people and individuals from lower socioeconomic backgrounds are overrepresented, which may have implications for research using this data and the conclusions drawn from it.
For the year-by-year analysis, the population figures for 2017–2021 are estimated based on projections from the census, which may not fully capture true population changes. The next census was conducted in April 2022 (delayed from April 2021 due to the COVID-19 pandemic). The publication of data from this (expected to be released in stages between 2023 and 202419) will provide an opportunity to evaluate contemporary eligibility rate using actual population figures, and to evaluate how eligibility patterns have changed by area over time.
Our area-level analysis required grouping of several counties and included only 18 areas, compared to 32 LHOs and 31 local authority areas. All of Dublin’s local authority areas were grouped into one area, resulting in an area with a very high population and no possibility of within area comparisons. As mentioned above, this meant that a closer examination of deprived and affluent areas was not possible. Releasing data at a more granular geographic area, or providing information to map townland-level Census figures to LHO areas for example, would allow for a more detailed analysis. In general alignment and harmonisation of how data is presented by various statutory bodies in health and elsewhere would enhance the secondary use of such data for research and other purposes.
This study uses the most up-to-date data available to provide age group, sex and area-based figures for GMS eligibility which may inform planning and conduct of research focusing on GMS-eligible individuals. We also provide the statistical code to import open data (where available) and conduct analysis, along with extracted data from the PCRS portal. Provision of open, interoperable PCRS eligibility data per month via Ireland’s Open Data Portal would enhance the usability of this data for research and wider purposes.
Zenodo: Data and code related to “Eligibility rates and representativeness of the General Medical Services scheme population in Ireland 2017–2021: A methodological report.” https://doi.org/10.5281/zenodo.70972549.
This project contains the following underlying data:
- age_sex_lho_eligibility_2016.xlsx (GMS eligibility figures by age group, sex, and LHO for 2016)
- age_sex_lho_eligibility_2017-2021.xlsx (GMS eligibility figures by age group, sex, and LHO for 2017–2021)
Additionally, data from the CSO datasets E3003 (Population 2011 to 2016) and PEA11 (Population estimates from 1926) were downloaded from the CSO website as described in the Stata do-file included in the repository.
Data are available under the terms of the Creative Commons Attribution 4.0 International license (CC-BY 4.0).
We would like to thank the HSE PCRS for providing data on the number of eligible individuals for April 2016, which were not openly available via their Reporting and Open Data platform (https://www.sspcrs.ie/portal/annual-reporting/).
Is the work clearly and accurately presented and does it cite the current literature?
Yes
Is the study design appropriate and is the work technically sound?
Yes
Are sufficient details of methods and analysis provided to allow replication by others?
Yes
If applicable, is the statistical analysis and its interpretation appropriate?
I cannot comment. A qualified statistician is required.
Are all the source data underlying the results available to ensure full reproducibility?
Yes
Are the conclusions drawn adequately supported by the results?
Yes
Competing Interests: No competing interests were disclosed.
Reviewer Expertise: Health services research, implementation science
Is the work clearly and accurately presented and does it cite the current literature?
Yes
Is the study design appropriate and is the work technically sound?
Yes
Are sufficient details of methods and analysis provided to allow replication by others?
Yes
If applicable, is the statistical analysis and its interpretation appropriate?
Yes
Are all the source data underlying the results available to ensure full reproducibility?
Yes
Are the conclusions drawn adequately supported by the results?
Yes
Competing Interests: No competing interests were disclosed.
Reviewer Expertise: Drug utilisation studies using PCRS pharmacy claims data. Health technology management.
Alongside their report, reviewers assign a status to the article:
| Invited Reviewers | ||
|---|---|---|
| 1 | 2 | |
|
Version 2 (revision) 18 Oct 23 |
||
|
Version 1 20 Oct 22 |
read | read |
Provide sufficient details of any financial or non-financial competing interests to enable users to assess whether your comments might lead a reasonable person to question your impartiality. Consider the following examples, but note that this is not an exhaustive list:
Sign up for content alerts and receive a weekly or monthly email with all newly published articles
Register with HRB Open Research
Already registered? Sign in
Submission to HRB Open Research is open to all HRB grantholders or people working on a HRB-funded/co-funded grant on or since 1 January 2017. Sign up for information about developments, publishing and publications from HRB Open Research.
We'll keep you updated on any major new updates to HRB Open Research
The email address should be the one you originally registered with F1000.
You registered with F1000 via Google, so we cannot reset your password.
To sign in, please click here.
If you still need help with your Google account password, please click here.
You registered with F1000 via Facebook, so we cannot reset your password.
To sign in, please click here.
If you still need help with your Facebook account password, please click here.
If your email address is registered with us, we will email you instructions to reset your password.
If you think you should have received this email but it has not arrived, please check your spam filters and/or contact for further assistance.
Comments on this article Comments (0)